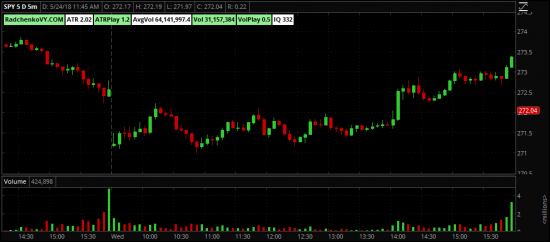
Рисует показатели акции прямо на графике
Позволяет быстро увидеть ATR акции, средний объем и т.д.

#Thinkorswim studies
#Рисует показатели акции прямо на графике.
#Позволяет быстро увидеть ATR акции, средний объем и т.д.
#Thinkorswim  https://RadchenkoVY.com/TOS

def length = 14;  # сколько дней учитывать при расчетах показателей
input AvgVolume = {default "1", "0"};
input ATR = {default "1", "0"};
input VolumePlay = {default "1", "0"};
input ATRPlay = {default "1", "0"};
input Volume_ = {default "1", "0"};
input IQTicker = {default "1", "0"};        #IQ
AddLabel (yes,"RadchenkoVY.COM", Color.LIGHT_GREEN);
def iATR = Round((Average(high(period = "DAY"), length ) - Average(low(period = "DAY"), length )), 2);
AddLabel (!ATR, "ATR " + iATR, Color.WHITE);
def iATRPlay = Round((high(period = "DAY") - low(period = "DAY")) / iATR, 1);
AddLabel (!ATRPlay, "ATRPlay " + iATRPlay, Color.LIGHT_GREEN);
def iAvgVolume = Round(Average (volume(period = "DAY")[1], length), 1);
AddLabel (!AvgVolume, "AvgVol " + iAvgVolume, Color.WHITE);
def iVolume = volume(period = "DAY");
AddLabel (!Volume_, "Vol " + iVolume, Color.LIGHT_GREEN);
def iVolumePlay = Round(iVolume / Average(volume(period = "DAY"), length), 1);
AddLabel (!VolumePlay, "VolPlay " + iVolumePlay, Color.LIGHT_GREEN);
def IQ = round ((iAvgVolume/390*iATR/1000),0);
AddLabel (!IQTicker, "IQ " + IQ, Color.WHITE);
Полная библиотека индикаторов, фильтрови и сканеров для Thinkorswim в этом блоге bit.ly/2vKq4F8
читать дальше на смартлабе


