Блог им. Scorpio0
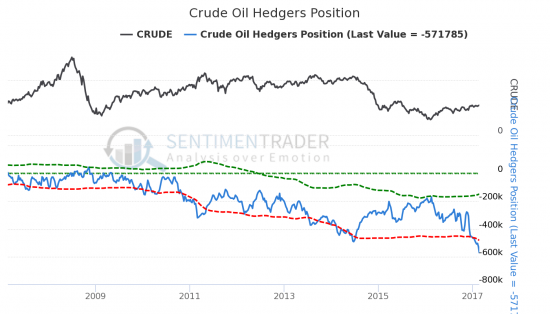
Crude Oil Hedgers Position
- 27 февраля 2017, 21:49
- |

Construction:
This chart shows the net number of contracts (longs minus shorts) held by large commercial hedgers. The green dotted line is 1 standard deviation above the 3-year average; the red dotted line is 1 standard deviation below the 3-year average.
Each week, the Commodity Futures Trading Commission (CFTC) releases information on the long and short positions of three groups of traders in a couple of dozen different futures markets in a report known as the Commitments of Traders.
The three groups are determined by the number of contracts they are currently holding, and are described as follows:
Commercial Hedgers — Commonly believed to be the «smart money», these traders are involved in the day-to-day operations of each commodity. They have an excellent handle on the underlying market, and it typically pays to follow their positions when they reach an extreme.
Large Speculators — This group mostly consists of large pooled funds, and almost always take the opposite side of commercial traders. The are primarily trend-followers, and will accumulate positions as a trend progresses. When their positions reach an extreme, watch for a price reversal in the opposite direction of the existing trend.
Non-Reportables (aka Small Speculators) — These are smaller traders, composed mostly of hedge funds and individual traders. Again, they are mostly trend-following in nature and we often see price reversals (in the opposite direction) when they hit an extreme.
By definition, commercial hedgers take the opposite side of the trades of large and small speculators. Therefore, when hedgers are net long, speculators are net short. Because hedgers tend to drive the market at extremes, we focus on them.
Commercial Hedgers are considered the smart money. When hedgers become net long to an extreme degree above the green dotted line, then we should be looking for the price of the commodity to rise. The opposite is true when they become so hedged that their position falls below the red dotted line.
You also want to look at the absolute level of positions, too — if they're at their greatest extreme in several years (even if they may not exceed the trading bands), then there's no question we're seeing a notable event.
To see small speculator positions, select it from the «Choose A Secondary Indicator» drop-down box near the top of the page. Large speculator positions are not shown due to redundancy.
теги блога Scorpio
- 50
- 2017
- API
- Baker
- Baker Hughes
- Bitcoin
- Bloomberg
- brent
- CFTC
- Crude
- DOE
- Dow
- EIA
- GOLD
- Hughes
- light
- MICEX
- MOEX
- Oil
- RBOB
- Rigs
- S&P500
- USD
- usdrub
- VIX
- wti
- ZeroHedge
- Акции
- Бензин
- Буровые
- Вена
- волатильность
- вопрос
- Встреча
- Гусев
- Дистилляты
- Добыча
- доллар
- Евро
- ЕС
- Запасы
- Золото
- индекс доллара
- Ирак
- Италия
- Китай
- коррекция
- Кукл
- Курдистан
- Курс
- курс доллара
- Кушинг
- Ливия
- Лица
- ЛЧИ
- Маркидонова
- Минфин
- Михеев
- Москва
- Набиуллина
- нефть
- Новый год
- Обвал
- опек+
- опрос
- оффтоп
- Падение
- прогноз
- Путин
- Резервы
- референдум
- Роснефть
- Россия
- Рост
- рубль
- Русские
- РФ
- Санкции
- Саудовская Аравия
- Сделка
- Сенаторы
- сентимент
- Силуанов
- СмартЛаб
- Смешинка
- сокращение
- Ставка
- США
- Трамп
- Тренд
- Улюкаев
- Физические
- ФРС
- Фьючерс
- Хай
- Хакеры
- ЦБ
- Цена
- Шип
- Юридические


это видимо продолжение ранее сегодня поднятой темы......
в исходнике......
наверно докопались до блумберга… :)))))
А как вы сами относитесь к тезису что
«Коммерческие хеджеры считаются умными (удачливыми) деньгами. Когда совокупная позиция хеджеров становится лонговой выше среднего нам следует ожидать роста цены»
Понятно что в запасе остается отмазка что является повышением цены и на каком интервале.......
и пойдет ли в зачет рост к хаям через перелой.....
Но к самой формулировке у вас какое отношение???
По мне — это чистое словоблудие. Статистически не подтверждаемое.
интересное для программ новостей или платных обзоров.
и реально денег не содержещей....
Хочу нарисовать свои графики, чтобы посмотреть где эти крайности и где развороты.