SMART-LAB
Новый дизайн
Мы делаем деньги на бирже
Tpaxte6eDox |Понравилось мнение по поводу возможного роста Индекса доллара.
- 07 сентября 2011, 19:47
- |
The entire concept of charting is based on the premise that geometric configurations tend to repeat themselves — of course, with slightly different variations.
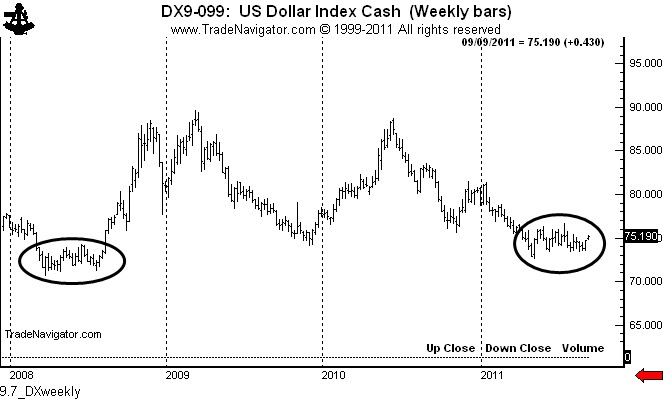
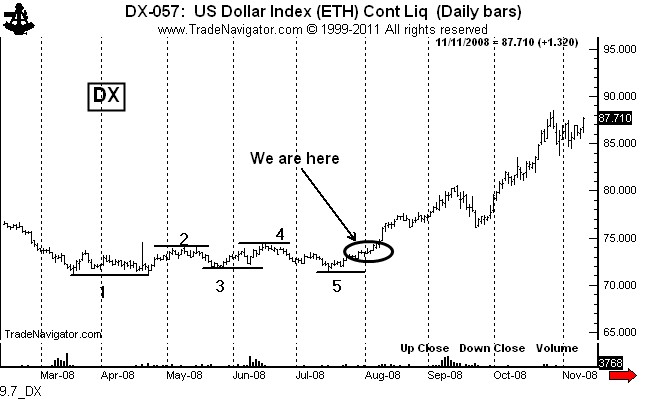
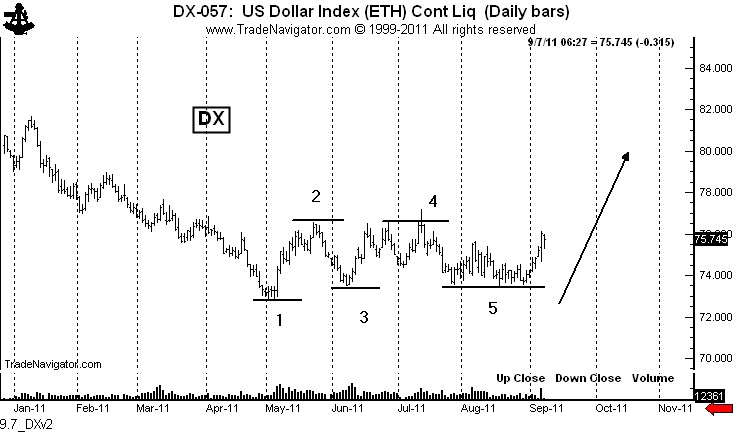
There is evidence that the U.S. Dollar is bottoming. In fact, the current 4-month bottom in the US$ is almost identical to the 5-month bottom in 2008.
Below find three charts:


There is evidence that the U.S. Dollar is bottoming. In fact, the current 4-month bottom in the US$ is almost identical to the 5-month bottom in 2008.
Below find three charts:
- The weekly graph, showing the 2008 bottom and the possible bottom at hand.
- The daily chart from 2008, showing five points of demarcation.
- The daily chart today, showing the same five points.


- комментировать
- Комментарии ( 1 )
- bitcoin
- brent
- eurusd
- forex
- gbpusd
- gold
- imoex
- ipo
- nasdaq
- nyse
- rts
- s&p500
- si
- usdrub
- wti
- акции
- алготрейдинг
- алроса
- аналитика
- аэрофлот
- банки
- биржа
- биткоин
- брокеры
- валюта
- вдо
- волновой анализ
- волны эллиотта
- вопрос
- втб
- газ
- газпром
- гмк норникель
- дивиденды
- доллар
- доллар рубль
- евро
- золото
- инвестиции
- индекс мб
- инфляция
- китай
- кризис
- криптовалюта
- лукойл
- магнит
- ммвб
- мобильный пост
- мосбиржа
- московская биржа
- мтс
- натуральный газ
- нефть
- новатэк
- новости
- обзор рынка
- облигации
- опрос
- опционы
- отчеты мсфо
- офз
- оффтоп
- прогноз
- прогноз по акциям
- путин
- раскрытие информации
- ри
- роснефть
- россия
- ртс
- рубль
- рынки
- рынок
- санкции
- сбер
- сбербанк
- северсталь
- сигналы
- смартлаб
- сущфакты
- сша
- технический анализ
- торговля
- торговые роботы
- торговые сигналы
- трамп
- трейдинг
- украина
- фондовый рынок
- форекс
- фрс
- фьючерс
- фьючерс mix
- фьючерс ртс
- фьючерсы
- цб
- цб рф
- экономика
- юмор
- яндекс


