индикатор
Плиточник - индикатор на графике цены, показывающий "плиты", большие объемы по позициям
- 22 сентября 2020, 08:37
- |
Вот так все выглядит на примере POGR-а от 21-го сентября.

С фьючерсами тоже должно работать.
Скачать бесплатно можно отсюда: https://кбс.онлайн/soft.html#as9
Инструкция по установке здесь: https://кбс.онлайн/note.html?id=16
Народ, кому надо — качайте сегодня, завтра сделаю платным.
- комментировать
- ★6
- Комментарии ( 9 )
Cканер вчерашнего движения акции
- 17 сентября 2020, 11:00
- |
⚙ Aggregation — day.
Лимит движения настраивается.
________
#PrevChange
#Акции, сходившие в последней свече больше N долларов.
#by thetrader.pro
#Aggregation — DAY
def iMove = 1.00; #минимальное движение за предыдущую свечу в долларах
plot iChange = absvalue (close[0] — open[0]) >= iMove;

Сканер - Превышение ATR
- 03 сентября 2020, 16:20
- |
📈Ищет акции, в которых ATR больше лимита.
⚙ Настроить можно сам лимит и период ATR.
1,5 — это минимальный ATR, который проходит акция.
14 — это число дней (период времени, за который ищем ATR).
Эти настройки вы можете менять как вам угодно
________
#ATR
#Список акций с ATR больше указанного
#by thetrader.pro
#Aggregation — DAY
def iATR = 1.5; #указать минимальный ATR
def periodATR = 14; #указать период ATR
plot bATR = (round((Average(high, periodATR)-Average(low, periodATR)),2)>=iATR);

Рубль. Индикатор. Уровни
- 28 августа 2020, 17:11
- |
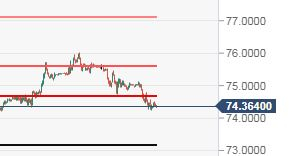
так-то вполне нормальная цена для покупки(яж покупал и 75,… но в апреле)
Рассчитываю без фонатизма увидеть не выше 76 сроком на 12-13 дней.
ТОС сканер - база в акции на любом уровне
- 20 августа 2020, 15:41
- |
📈Ищет акции, в которых появились базы на любом ценовом уровне.
⚙ Для баз стандартные настройки максимального отклонения от уровня и число баров для формирования самой базы.
Agregation выставляется по таймфрейму, по которому вы хотите искать.
________
#Base
#Сканер ищет проторговки из N последних свечей, на любых уровнях.
#by thetrader.pro
def iDiff = 0.01; #максимальное отклонение в центах
def iBars = 4; #число баров для просмотра
def iLowest = lowest(low,iBars);
def iHighest = highest(high,iBars);
def bBaseLow = fold Lbar = 0 to iBars with Ls=1 do if ((low[Lbar]-iLowest)<=iDiff) then Ls*1 else Ls*0;
def bBaseHigh = fold Hbar = 0 to iBars with Hs=1 do if ((iHighest-high[Hbar])<=iDiff) then Hs*1 else Hs*0;
plot bBase = bBaseLow or bBaseHigh;

EUR_RUB новый индюк.
- 11 августа 2020, 17:06
- |
если сваливается ниже — на лонг работать убыточно.
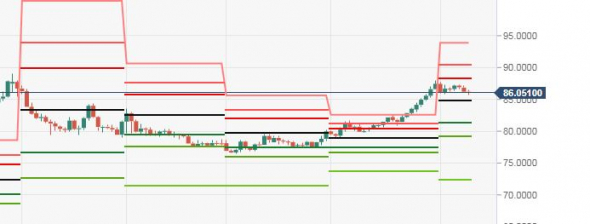
а у вас какие есть индюки?
Теория хаоса. Или как я почувствовал себя Эдвардом Лоренцом.
- 10 августа 2020, 12:01
- |
Она категорически чувствительна к начальным условиям.
На картинках обычно это представляют так:
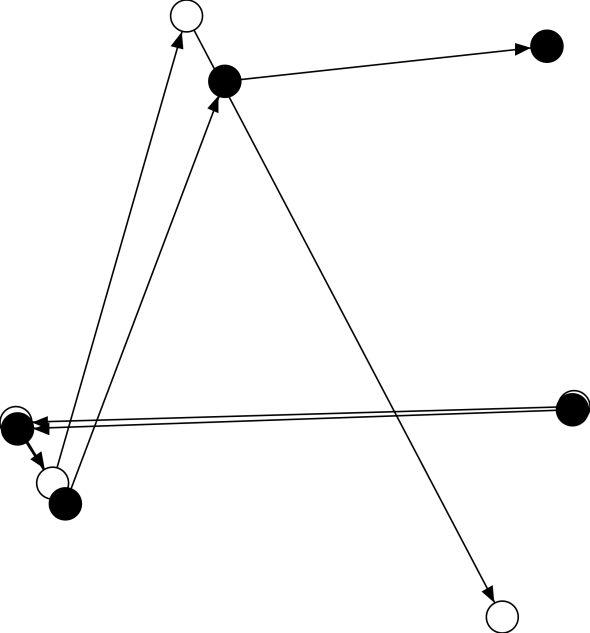
Как нам рассказывают различные источники, непосредственно столкнулся с этим американский ученый Эдвард Лоренц, основоположник теории хаоса.
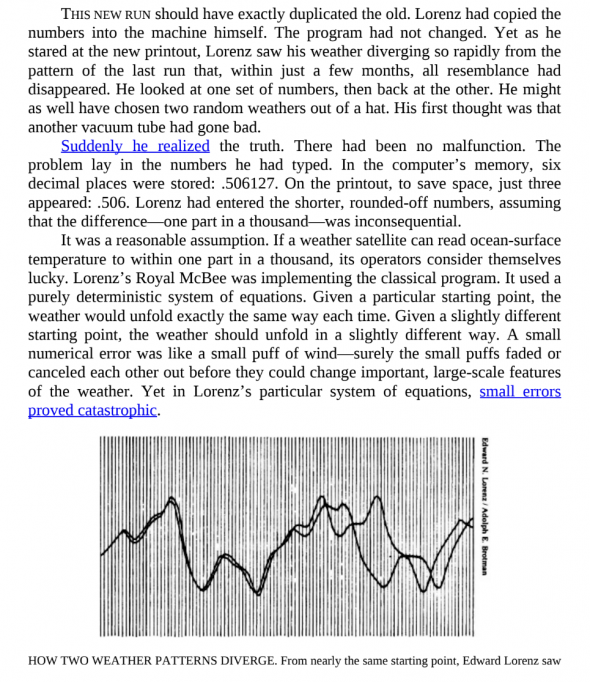
Вот что об этом пишет Джеймс Глейк в книге «Chaos: Making a New Science»:
( Читать дальше )
Разрыв в индикаторе (Gap in p/e) только увеличивается. Новая экономика США
- 09 августа 2020, 01:20
- |
Эксперименту с индикатором P/E почти 1 год. Два портфеля, в каждом 50 акций, с низким и высоким PE. Вот что получилось:
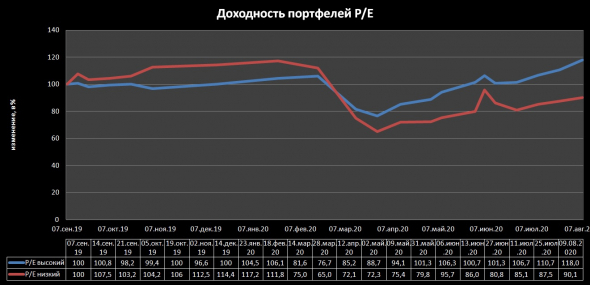
Разрыв между портфелями только увеличивается, то есть компании, которые год назад были «переоценены рынком по индикатору цена/прибыль» продолжают расти лучше рынка и лучше акций, у которых P/e год назад был ниже 20.
Вот здесь всё начиналось
Думаю, на этом можно заканчивать?
Во-первых, ситуация сильно изменилась за год и теперь большинство «недооцененных» компаний теперь покупать вовсе не хочется (сарказм)
Во-вторых, среди «акций роста» (к ним я отношу практически все из портфеля с высоким PE), некоторые начинают притормаживать, а на их место пора брать новых «лидеров рынка»...
( Читать дальше )
Нужен индикатор на квик, штатный мура...
- 06 августа 2020, 20:33
- |
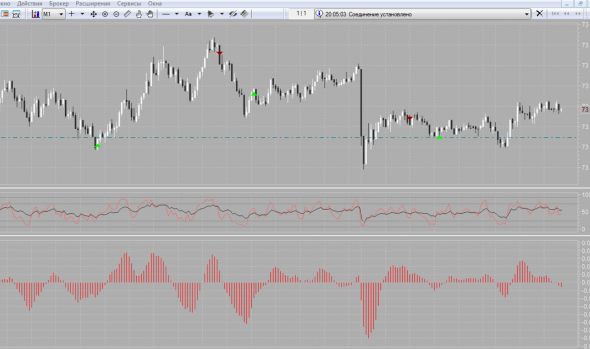
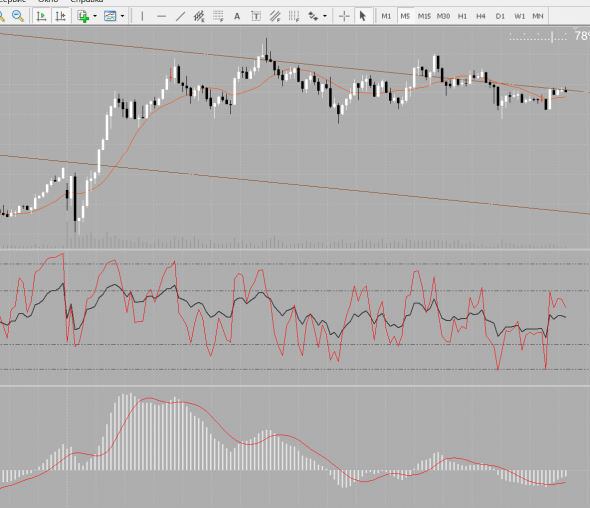
Есть тут умельцы, нужно индикатор в квике такой же сделать.
в квике вот это
а нужно вот это
( Читать дальше )
- bitcoin
- brent
- eurusd
- forex
- gbpusd
- gold
- imoex
- ipo
- nasdaq
- nyse
- rts
- s&p500
- si
- usdrub
- wti
- акции
- алготрейдинг
- алроса
- аналитика
- аэрофлот
- банки
- биржа
- биткоин
- брокеры
- валюта
- вдо
- волновой анализ
- волны эллиотта
- вопрос
- втб
- газ
- газпром
- гмк норникель
- дивиденды
- доллар
- доллар рубль
- евро
- золото
- инвестиции
- индекс мб
- инфляция
- китай
- кризис
- криптовалюта
- лукойл
- магнит
- ммвб
- мобильный пост
- мосбиржа
- московская биржа
- мтс
- натуральный газ
- нефть
- новатэк
- новости
- обзор рынка
- облигации
- опрос
- опционы
- отчеты мсфо
- офз
- оффтоп
- прогноз
- прогноз по акциям
- путин
- раскрытие информации
- ри
- роснефть
- россия
- ртс
- рубль
- рынки
- рынок
- санкции
- сбер
- сбербанк
- северсталь
- сигналы
- смартлаб
- сущфакты
- сша
- технический анализ
- торговля
- торговые роботы
- торговые сигналы
- трамп
- трейдинг
- украина
- фондовый рынок
- форекс
- фрс
- фьючерс
- фьючерс mix
- фьючерс ртс
- фьючерсы
- цб
- цб рф
- экономика
- юмор
- яндекс


 Новости тг-канал