SMART-LAB
Новый дизайн
Мы делаем деньги на бирже
Блог им. sereja14 |Формулы для ThinkOrSwim (TOS). Фибоначчи на графике
- 05 сентября 2018, 22:46
- |
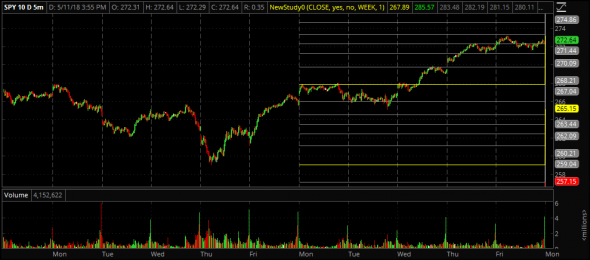
Показывает на графике уровни Фибоначчи по предыдущему недельному бару

Мне очень помогает увидеть важные уровни с прошлой недели часто отрабатывающиеся по фибоначчи. Раньше приходилось вручную выставлять уровни, теперь это автоматически с помощью след формулы:

Мне очень помогает увидеть важные уровни с прошлой недели часто отрабатывающиеся по фибоначчи. Раньше приходилось вручную выставлять уровни, теперь это автоматически с помощью след формулы:
#Thinkorswim studies
#FIBO по прошлой неделе
#Показывает на графике уровни Фибоначчи по предыдущему недельному бару
#Thinkorswim  https://RadchenkoVY.com/TOS

input price = close;
input showOnlyToday = yes;
input ShowLabels = no;
input period = AggregationPeriod.WEEK; # если нужно чтобы показывало Фибоначчи по бару не предыдущей недели, а вчерашнего дня, то измените здесь просто на AggregationPeriod.DAY;
input displace = 1;


def prevHigh = if (showOnlyToday and !IsNaN(close(period = period)[-1])) or isnan(close[1]) then double.nan else high(period = period)[displace];
def prevLow = if (showOnlyToday and !IsNaN(close(period = period)[-1])) or isnan(close[1]) then double.nan else low(period = period)[displace];
def shouldplot = yes;


plot pivot = if shouldPlot then (prevHigh) else Double.NaN;
pivot.SetStyle(Curve.FIRM);
pivot.SetDefaultColor(Color.yelLOW);


plot h7 = if shouldPlot then pivot + 2 * (prevHigh - prevLow) else Double.NaN;
h7.SetStyle(Curve.FIRM);
h7.SetDefaultColor(Color.Green);

plot h8 = if shouldPlot then pivot + 1.764 * (prevHigh - prevLow) else Double.NaN;
h8.SetStyle(Curve.FIRM);
h8.SetDefaultColor(Color.gRAY);

plot h9 = if shouldPlot then pivot + 1.618 * (prevHigh - prevLow) else Double.NaN;
h9.SetStyle(Curve.FIRM);
h9.SetDefaultColor(Color.gRAY);

plot h10 = if shouldPlot then pivot + 1.5 * (prevHigh - prevLow) else Double.NaN;
h10.SetStyle(Curve.FIRM);
h10.SetDefaultColor(Color.gRAY);

plot h11 = if shouldPlot then pivot + 1.382 * (prevHigh - prevLow) else Double.NaN;
h11.SetStyle(Curve.FIRM);
h11.SetDefaultColor(Color.gRAY);

plot h12 = if shouldPlot then pivot + 1.214 * (prevHigh - prevLow) else Double.NaN;
h12.SetStyle(Curve.FIRM);
h12.SetDefaultColor(Color.gRAY);


plot h1 = if shouldPlot then pivot + 1 * (prevHigh - prevLow) else Double.NaN;
h1.SetStyle(Curve.FIRM);
h1.SetDefaultColor(Color.GREEN);

plot h2 = if shouldPlot then pivot + 0.764 * (prevHigh - prevLow) else Double.NaN;
h2.SetStyle(Curve.FIRM);
h2.SetDefaultColor(Color.gRAY);

plot h3 = if shouldPlot then pivot + 0.618 * (prevHigh - prevLow) else Double.NaN;
h3.SetStyle(Curve.FIRM);
h3.SetDefaultColor(Color.gRAY);

plot h4 = if shouldPlot then pivot + 0.5 * (prevHigh - prevLow) else Double.NaN;
h4.SetStyle(Curve.FIRM);
h4.SetDefaultColor(Color.gRAY);

plot h5 = if shouldPlot then pivot + 0.382 * (prevHigh - prevLow) else Double.NaN;
h5.SetStyle(Curve.FIRM);
h5.SetDefaultColor(Color.gRAY);

plot h6 = if shouldPlot then pivot + 0.214 * (prevHigh - prevLow) else Double.NaN;
h6.SetStyle(Curve.FIRM);
h6.SetDefaultColor(Color.gRAY);


plot l1 = if shouldPlot then pivot - 1 * (prevHigh - prevLow) else Double.NaN;
l1.SetStyle(Curve.FIRM);
l1.SetDefaultColor(Color.yelLOW);

plot l2 = if shouldPlot then pivot - 0.764 * (prevHigh - prevLow) else Double.NaN;
l2.SetStyle(Curve.FIRM);
l2.SetDefaultColor(Color.gRAY);

plot l3 = if shouldPlot then pivot - 0.618 * (prevHigh - prevLow) else Double.NaN;
l3.SetStyle(Curve.FIRM);
l3.SetDefaultColor(Color.gRAY);

plot l4 = if shouldPlot then pivot - 0.5 * (prevHigh - prevLow) else Double.NaN;
l4.SetStyle(Curve.FIRM);
l4.SetDefaultColor(Color.gRAY);

plot l5 = if shouldPlot then pivot - 0.382 * (prevHigh - prevLow) else Double.NaN;
l5.SetStyle(Curve.FIRM);
l5.SetDefaultColor(Color.gRAY);

plot l6 = if shouldPlot then pivot - 0.214 * (prevHigh - prevLow) else Double.NaN;
l6.SetStyle(Curve.FIRM);
l6.SetDefaultColor(Color.gRAY);


plot l7 = if shouldPlot then pivot - 2 * (prevHigh - prevLow) else Double.NaN;
l7.SetStyle(Curve.FIRM);
l7.SetDefaultColor(Color.RED);

plot l8 = if shouldPlot then pivot - 1.764 * (prevHigh - prevLow) else Double.NaN;
l8.SetStyle(Curve.FIRM);
l8.SetDefaultColor(Color.gRAY);

plot l9 = if shouldPlot then pivot - 1.618 * (prevHigh - prevLow) else Double.NaN;
l9.SetStyle(Curve.FIRM);
l9.SetDefaultColor(Color.gRAY);

plot l10 = if shouldPlot then pivot - 1.5 * (prevHigh - prevLow) else Double.NaN;
l10.SetStyle(Curve.FIRM);
l10.SetDefaultColor(Color.gRAY);

plot l11 = if shouldPlot then pivot - 1.382 * (prevHigh - prevLow) else Double.NaN;
l11.SetStyle(Curve.FIRM);
l11.SetDefaultColor(Color.gRAY);

plot l12 = if shouldPlot then pivot - 1.214 * (prevHigh - prevLow) else Double.NaN;
l12.SetStyle(Curve.FIRM);
l12.SetDefaultColor(Color.gRAY);
Полная библиотека индикаторов, фильтров и и сканеров для Thinkorswim в этом блоге http://bit.ly/2vKq4F8
- комментировать
- ★10
- Комментарии ( 0 )
Блог им. sereja14 |Поиск баз (проторговок) в Thinkorswim TOS
- 27 августа 2018, 12:30
- |
<strong>#Ищет базу на любых уровнях.</strong>
#Cнять галочку Include Extended Session
#Thinkorswim  https://RadchenkoVY.com/TOS


def iDiff = 0.00; #максимальное отклонение в центах
def iBars = 4; #число баров для просмотра
def iLowest = lowest(low,iBars);
def iHighest = highest(high,iBars);
def bBaseLow = fold Lbar = 0 to iBars with Ls=1 do if ((low[Lbar]-iLowest)<=iDiff) then Ls*1 else Ls*0;
def bBaseHigh = fold Hbar = 0 to iBars with Hs=1 do if ((iHighest-high[Hbar])<=iDiff) then Hs*1 else Hs*0;
plot bBase = if bBaseLow then 1 else if bBaseHigh then 2 else 100;
AssignBackgroundColor (if (bBase == 1) then Color.LIGHT_GREEN else if (bBase == 2) then Color.LIGHT_RED else Color.black);
bBase.AssignValueColor (if bBase <> 100 then Color.black else Color.CURRENT);

<strong>#Ищет базу на уровнях кратным 50 центам.</strong>
#Cнять галочку Include Extended Session
#Thinkorswim  https://RadchenkoVY.com/TOS

def iDiff = 0.00; #максимальное отклонение в центах
def iBars = 4; #число баров для просмотра
def iLowest = lowest(low,iBars);
def iHighest = highest(high,iBars);
def bBaseLow = fold Lbar = 0 to iBars with Lsumm=1 do if  ((low[Lbar]-iLowest)<=iDiff) then Lsumm*1 else Lsumm*0;
def bBaseHigh = fold Hbar = 0 to iBars with Hsumm=1 do  if ((iHighest-high[Hbar])<=iDiff) then Hsumm*1 else  Hsumm*0;
def iFigureLow = fold FLbar = 1 to iBars+1 with FLsumm  do if (low[FLbar] == (Floor(low[FLbar]*2))/2) then  FLsumm+1 else FLsumm;
def iFigureHigh = fold FHbar = 1 to iBars+1 with FHsumm  do if (high[FHbar] == (Ceil(high[FHbar]*2))/2) then  FHsumm+1 else FHsumm;
plot bBase = if (bBaseLow and iFigureLow) then 1 else if  (bBaseHigh and iFigureHigh) then 2 else 100;
AssignBackgroundColor (if (bBase == 1) then Color.LIGHT_GREEN else if (bBase == 2) then Color.LIGHT_RED else Color.black);
bBase.AssignValueColor (if bBase <> 100 then Color.black else Color.CURRENT);
( Читать дальше )
Блог им. sereja14 |Индикатор ThinkOrSwim для Charts
- 06 августа 2018, 15:24
- |
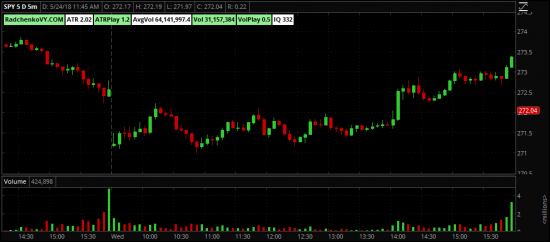
Рисует показатели акции прямо на графике
Позволяет быстро увидеть ATR акции, средний объем и т.д.

Позволяет быстро увидеть ATR акции, средний объем и т.д.

#Thinkorswim studies
#Рисует показатели акции прямо на графике.
#Позволяет быстро увидеть ATR акции, средний объем и т.д.
#Thinkorswim  https://RadchenkoVY.com/TOS

def length = 14;  # сколько дней учитывать при расчетах показателей
input AvgVolume = {default "1", "0"};
input ATR = {default "1", "0"};
input VolumePlay = {default "1", "0"};
input ATRPlay = {default "1", "0"};
input Volume_ = {default "1", "0"};
input IQTicker = {default "1", "0"};        #IQ
AddLabel (yes,"RadchenkoVY.COM", Color.LIGHT_GREEN);
def iATR = Round((Average(high(period = "DAY"), length ) - Average(low(period = "DAY"), length )), 2);
AddLabel (!ATR, "ATR " + iATR, Color.WHITE);
def iATRPlay = Round((high(period = "DAY") - low(period = "DAY")) / iATR, 1);
AddLabel (!ATRPlay, "ATRPlay " + iATRPlay, Color.LIGHT_GREEN);
def iAvgVolume = Round(Average (volume(period = "DAY")[1], length), 1);
AddLabel (!AvgVolume, "AvgVol " + iAvgVolume, Color.WHITE);
def iVolume = volume(period = "DAY");
AddLabel (!Volume_, "Vol " + iVolume, Color.LIGHT_GREEN);
def iVolumePlay = Round(iVolume / Average(volume(period = "DAY"), length), 1);
AddLabel (!VolumePlay, "VolPlay " + iVolumePlay, Color.LIGHT_GREEN);
def IQ = round ((iAvgVolume/390*iATR/1000),0);
AddLabel (!IQTicker, "IQ " + IQ, Color.WHITE);
Полная библиотека индикаторов, фильтрови и сканеров для Thinkorswim в этом блоге bit.ly/2vKq4F8
- bitcoin
- brent
- eurusd
- forex
- gbpusd
- gold
- imoex
- ipo
- nasdaq
- nyse
- rts
- s&p500
- si
- usdrub
- wti
- акции
- алготрейдинг
- алроса
- аналитика
- аэрофлот
- банки
- биржа
- биткоин
- брокеры
- валюта
- вдо
- волновой анализ
- волны эллиотта
- вопрос
- втб
- газ
- газпром
- гмк норникель
- дивиденды
- доллар
- доллар рубль
- евро
- золото
- инвестиции
- индекс мб
- инфляция
- китай
- кризис
- криптовалюта
- лукойл
- магнит
- ммвб
- мобильный пост
- мосбиржа
- московская биржа
- мтс
- натуральный газ
- нефть
- новатэк
- новости
- обзор рынка
- облигации
- опрос
- опционы
- отчеты мсфо
- офз
- оффтоп
- прогноз
- прогноз по акциям
- путин
- раскрытие информации
- ри
- роснефть
- россия
- ртс
- рубль
- рынки
- рынок
- санкции
- сбер
- сбербанк
- северсталь
- сигналы
- смартлаб
- сущфакты
- сша
- технический анализ
- торговля
- торговые роботы
- торговые сигналы
- трамп
- трейдинг
- украина
- фондовый рынок
- форекс
- фрс
- фьючерс
- фьючерс mix
- фьючерс ртс
- фьючерсы
- цб
- цб рф
- экономика
- юмор
- яндекс


