Избранное трейдера ✔Бизне$$ Ангел ✰
FAQ по платежной системе UnionPay и Телеграм канал по этой системе. В избранное.
- 12 марта 2022, 21:44
- |
1. Что это вообще такое?
UnionPay (UP, «Юпи», читается «Юнион Пэй») — китайская карточная платежная система, аналог и конкурент Visa и MasterCard, но при этом не Visa, не MasterCard, не JCB, не МИР и не American Express. Третья платёжная система в мире по известности после «двух гигантов».
2. Где она популярна?
Утверждают, что «в 180 странах мира», в основном, конечно, в Китае и странах Юго-Восточной Азии (Таиланд, Сингапур, Малайзия, итд). Весьма популярна в ОАЭ и странах Персидского залива, в Турции и даже в СНГ (Узбекистан, Таджикистан).
3. Зачем оно мне?
Кратко — чтобы иметь возможность платить за рубежом, как на сайтах, так и в магазинах и кафе, снимать деньги в банкоматах за границей, т.е. пользоваться картой и дальше.
Почему так — да потому что карты российских банков больше не работают за рубежом. Вы не сможете оплатить что-то на зарубежных сайтах российскими картами Visa и MasterCard за несколькими исключениями типа AliExpress, который научился принимать «МИР». Не сможете не только оплатить в магазине, гостинице, в кафе или снять деньги в банкомате, но и оплатить что-то на иностранном сайте в интернете, где нужно вводить данные своей карты.
( Читать дальше )
- комментировать
- ★46
- Комментарии ( 40 )
Как решить проблему с заполнением декларации у иностранных брокеров
- 21 декабря 2021, 11:39
- |
Налоговая сказала: пересчитать все в рубли и заполнить декларацию.
Я посмотрел отчеты по сделкам и ахнул — там сотни страниц сделок за каждый год, как это все расчехлять и представлять в налоговую — не ясно.
Сказать что я приуныл — значит ничего не сказать.
К счастью, проблема решилась гораздо гораздо проще. Из недр смартлаба явился святой человек — Виктор Бавин, который сказал, что их бухгалтеры сотнями такие налоговые отчеты заполняют и предложил помощь.

В итоге: отчеты за 3 года мне сделали за 1 день, сами их за меня отправили в налоговую в виде деклараций и приложений.
Налоговая все приняла и выставила мне в кабинете счета, которые я оплатил.
Потом правда еще пришлось оплатить штрафы за то, что своевременно не подал декларации.
В общем, если вам надо ВОВРЕМЯ сделать декларашку по Interactive Brokers или Exante или какому другому иностранному брокеру, пишите ему bavin.vict@yandex.ru
Цены такие:
до 100 сделок $50
От 100 до 1000 это $100
Свыше 1000 сделок $200
Как самому предсказать дефолт без знаний за 5 минут?
- 23 сентября 2021, 15:01
- |
Здравствуйте, юные инвесторы, начинающие и продвинутые. На смартлабе я 4 месяца с небольшим, но этого времени было достаточно, чтобы написать около 70-и статей по финансовому анализу, обрести единомышленников, друзей и подписчиков. Я очень сильно вам всем благодарен за ту поддержку, которую вы мне оказывали при нападках хейтеров, за дельные советы и тёплые слова в комментариях. Я хочу вам всем сказать спасибо за то, что вам интересен финансовый анализ и за то, что вам интересны мои выводы в отношении той или иной конторы. Спасибо.

Оценка инвестиционного риска «ЛИСП-ИР»
Написать сегодняшний пост, меня побудило желание не распрощаться со смартлабом, как наверное уже некоторые подумали, а поделиться с вами, в знак благодарности, программой, которую я написал специально для вас.
( Читать дальше )
Способы оптимизации налогов.
- 22 сентября 2021, 09:20
- |
Я понимаю, если бы налоги шли на улучшение жизни населения, даже готов платить. Но тогда правительству нужно давать отчет — куда ушли деньги.
На текущий момент государство, в лице его чиновников, тупо разворовывает налоги. При этом открыто говорит нам всем об этом.
С другой стороны, в споре с мособлбанком, государство в лице ЦБ РФ, прокуратуры и ВС прямым текстом подписало мне высшую меру, ибо если бы банк в итоге не решил бы вернуть деньги с вкладов, мне бы пришлось умереть.
У меня на стене в рамочке висит решение ВС РФ по вопросу мособлбанка, чтобы помнить кому и чем я обязан.
Напомню суть проблемы, банк заблокировал мне ден средства на вкладах, потребовал отдать им договор вклада и ПКО на 15 дневную верификацию. От ЦБ РФ и прокуратуры последовали отписки.
В суде мособлбанк, совместно с СМП банком, объявили меня недобросовестным, злоупотребляющим правом. На этом основании отказались исполнять договор вклада. Предварительно вернув в ходе суда деньги с вклада.
( Читать дальше )
Торговая система.
- 15 сентября 2021, 21:32
- |
Истина же заключается в том, что рабочую систему, позволяющую масштабировать прибыль вам ни кто ни когда не продаст, ни за какие деньги.
Я вот тоже долго искал комфортную ТС на срочном рынке.
В итоге остановился на шорте фьюча лесенкой под наличный бакс (евро).
Что имеем.
1. 10 лотов наличного евро, купленных по 70 руб в 20 году.
2. 10 лотов фьючерса евро/рубля продаваемых лесенкой со спредом 2 руб.
3. Фикс прибыли от 2000 руб.
4. Ежедневно выплачиваемое контанго по фьючерсу, в среднем 1200-1500 пунктов каждые 3 месяца.
5. ГО 10 тыс руб и ОФЗ.
Риски
1. Уход курса выше 95 руб — тупо закрою срочку наличным евро.
2. Проблемы с брокером, отсутствие времени - тупо закрою срочку наличным евро.
Итоги за год -
по наличному евро — 160 тыс руб прибыли
по срочке 170 тыс прибыли.
Общая доходность, с учетом размещенных ден средств (10 лотов евро) 750 тыс руб, около 45%.
( Читать дальше )
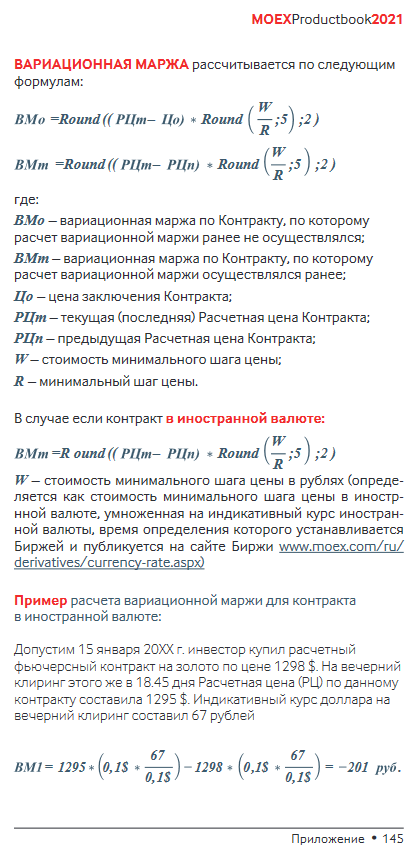
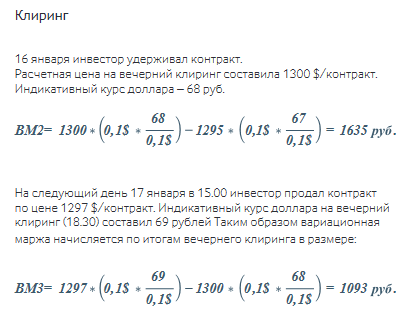
Как вы теряете на валютных фьючерсах Московской биржи
- 15 июня 2021, 01:11
- |
Итак, начнем с pdf-документа, который выложен на сайте МосБиржи на странице под якорем «Все продукты Срочного рынка». Для экономии вашего времени, привожу скрины страниц 145-147.


( Читать дальше )
Иногда, нужна перезагрузка. Тунис: полёты начались. Куба: интересный вариант. Европу не заменит. ПЦР тесты на COVID-19 (советы).
- 02 мая 2021, 16:53
- |
Рубль, доллар, фонда, фьючи.. .
Могут немного и подождать (пока — «на заборе»).
Представляю, какой будет отложенный спрос, когда ослабнут эти ограничения.
С пандемией всё сложнее: обычно летим всей семьёй, а это тяжелее.
Для сравнения:
Турпоток в Турцию и Египет до запрета полётов в Египет.

Много писали про накопления россиян:
доходы растут и накопления растут (потому что не тратят).
Ситуация меняется.
Конечно, на курс рубля вряд ли сильно повлияет возможное открытие чартеров в Египет.
Открывается Тунис (визы нет, карантина для турю групп нет): на курс Тунис вообще не повлияет..
Для богатых, Мальдивы.
Летом доллары на личные расходы обычно больше нужны.
Как в анекдоте.
— Нужны деньги.
— Очень нужны деньги.
— Все, меняем немного валюты.
( Читать дальше )
Опционы. Тесты бабочки, зигзага, стрэнгла и кондора
- 09 апреля 2021, 01:24
- |
В этой статье мы рассмотрим результаты тестирования бабочки, стрэнгла, кондора и зигзага(risk reversal).
Очевидно, что обычно трейдеры входят в эти позиции, имея свой прогноз по базовому активу и волатильности.
Тем не менее, мне было интересно, дают ли указанные спреды постоянное статистическое преимущество, способное компенсировать неверный прогноз. Отрицательный результат теста не является приговором, ведь он получен при ограниченном наборе методов выбора позиции и хеджа.
Подробнее о расчетах
Во многом техника тестов повторяет ту, которая была использована ранее при анализе единичных опционов.
Тестируются только месячные опционы на индекс РТС.
Расчеты основаны на теоретической стоимости опционов с июня 2010 г. по июнь 2018 г.
Данные предоставлены Московской Биржей и одним из известных опционных трейдеров, которому выражаю благодарность.
( Читать дальше )
Данные из QUIK в Python. Построение Дельта графика.
- 20 февраля 2021, 17:35
- |
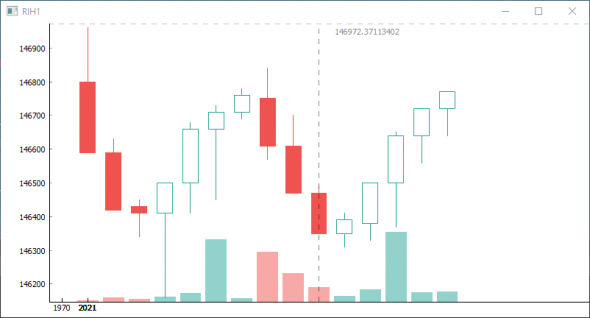
 Построение нестандартных графиков в Python при помощи библиотеки finplot.
Можно строить почти любые нестандартные графики: Range, Renco, Delta.
В качестве примера скрипт для построения Дельта графика.
График строиться с момента запуска по поступающим данным из таблицы обезличенных сделок.
Для получения данных из КВИКа используется PythonServer Евгения Шибаева (огромное спасибо автору!!!)
Тапками не кидайтесь, программировать только учусь.
# В КВИКе запускаем луа-скрипт QuikLuaPython.lua
import socket
import threading
from datetime import datetime, timezone
import pandas as pd
import finplot as fplt

fplt.display_timezone = timezone.utc


class DeltaBar():
    def __init__(self):
        self.df = pd.DataFrame(columns='date_time open high low close delta delta_time_sec'.split(' '))
        self.df.loc[len(self.df)] = [0, 0, 0, 0, 0, 0, 0]

    def parser(self, parse):
        if parse[0] == '1' and parse[1] == 'RIH1':
            if abs(self.df.iloc[len(self.df) - 1]['delta']) >= 500:
                self.df.loc[len(self.df)] = [0, 0, 0, 0, 0, 0, 0]  # Добавляем строку в DF

            self.df.iloc[len(self.df) - 1]['close'] = float(parse[4])  # Записываем последнюю цену как цену close бара

            if self.df.iloc[len(self.df) - 1]['date_time'] == 0:
                self.df.iloc[len(self.df) - 1]['date_time'] = \
                    datetime.strptime(f'{parse[7]} {parse[8][0:-1]}', "%d.%m.%Y %H:%M:%S.%f").replace(microsecond=0)

            if self.df.iloc[len(self.df) - 1]['open'] == 0:
                self.df.iloc[len(self.df) - 1]['open'] = float(parse[4])

            if float(parse[4]) > self.df.iloc[len(self.df) - 1]['high']:
                self.df.iloc[len(self.df) - 1]['high'] = float(parse[4])

            if (float(parse[4]) < self.df.iloc[len(self.df) - 1]['low']) or \
                    (self.df.iloc[len(self.df) - 1]['low'] == 0):
                self.df.iloc[len(self.df) - 1]['low'] = float(parse[4])

            if parse[5] == '1026':
                self.df.iloc[len(self.df) - 1]['delta'] += float(parse[6])

            if parse[5] == '1025':
                self.df.iloc[len(self.df) - 1]['delta'] -= float(parse[6])

            self.df.iloc[len(self.df) - 1]['delta_time_sec'] = \
                datetime.strptime(f'{parse[7]} {parse[8][0:-1]}', "%d.%m.%Y %H:%M:%S.%f") - \
                self.df.iloc[len(self.df) - 1]['date_time']
            self.df.iloc[len(self.df) - 1]['delta_time_sec'] = self.df.iloc[len(self.df) - 1]['delta_time_sec'].seconds


def service():
    sock = socket.socket(socket.AF_INET, socket.SOCK_DGRAM)
    sock.bind(('127.0.0.1', 3587))  # Хост-этот компьютер, порт - 3587
    while True:
        res = sock.recv(2048).decode('utf-8')
        if res == '<qstp>\n':  # строка приходит от клиента при остановке луа-скрипта в КВИКе
            break
        else:
            delta_bar.parser(res.split(' '))  # Здесь вызываете свой парсер. Для примера функция: parser (parse)
    sock.close()


def update():

    df = delta_bar.df
    # Меняем индекс и делаем его типом datetime
    df = df.set_index(pd.to_datetime(df['date_time'], format='%Y-%m-%d %H:%M:%S'))
    # print(delta_bar.df)

    # pick columns for our three data sources: candlesticks and TD
    candlesticks = df['open close high low'.split()]
    volumes = df['open close delta_time_sec'.split()]
    if not plots:
        # first time we create the plots
        global ax
        plots.append(fplt.candlestick_ochl(candlesticks))
        plots.append(fplt.volume_ocv(volumes, ax=ax.overlay()))
    else:
        # every time after we just update the data sources on each plot
        plots[0].update_data(candlesticks)
        plots[1].update_data(volumes)


if __name__ == '__main__':
    delta_bar = DeltaBar()
    # Запускаем сервер в своем потоке
    t = threading.Thread(name='service', target=service)
    t.start()

    plots = []
    ax = fplt.create_plot('RIH1', init_zoom_periods=100, maximize=False)
    update()
    fplt.timer_callback(update, 2.0)  # update (using synchronous rest call) every N seconds

    fplt.show()
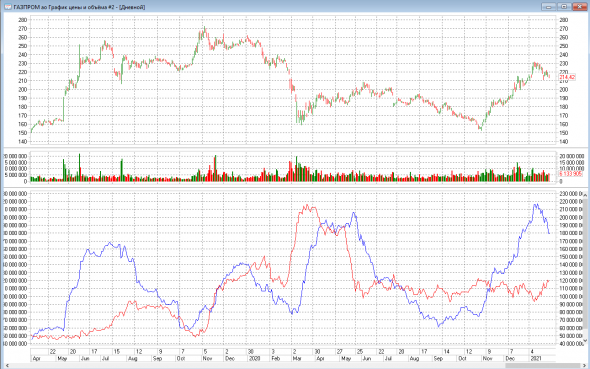
MAV2 индикатор объемов положительных и отрицательных баров
- 30 января 2021, 20:05
- |

--[[
MA volumn up down
--]]
Settings=
        {
            Name = "MAV2",   -- indicator name
            per=10,               -- period
            line=
                {
                    {
                        Name = "MA",
                        Type =TYPE_LINE,
                        Width = 1,
                        Color = RGB(0,0,255)
                    },
                    {
                        Name = "MA2",
                        Type =TYPE_LINE,
                        Width = 1,
                        Color = RGB(255,0,0)
                    }
                }
       }


function Init()
  mav1 = {}
  mav2 = {}
  return 2
end


function OnCalculate(index)

  per = Settings.per

  if index > 1 then
    curv = C(index)
    prevv = C(index-1)
  else
    curv = C(index)
    prevv = C(index)
  end

  if curv - prevv > 0 then
    if index > 1 then
      mav1[index] = mav1[index-1] + V(index)
	  mav2[index] = mav2[index-1]
    else
      mav1[index] = V(index)
	  mav2[index] = 0
    end
  else
    if index > 1 then
	  mav1[index] = mav1[index-1]
      mav2[index] = mav2[index-1] + V(index)
    else
	  mav1[index] = 0
      mav2[index] = V(index)
    end
  end

  if index > per then
    vv1 = mav1[index] - mav1[index-per]
	vv2 = mav2[index] - mav2[index-per]
  else
    vv1 = 0
	vv2 = 0
  end

  return vv1, vv2

end- bitcoin
- brent
- eurusd
- forex
- gbpusd
- gold
- imoex
- ipo
- nasdaq
- nyse
- rts
- s&p500
- si
- usdrub
- wti
- акции
- алготрейдинг
- алроса
- аналитика
- аэрофлот
- банки
- биржа
- биткоин
- брокеры
- валюта
- вдо
- волновой анализ
- волны эллиотта
- вопрос
- втб
- газ
- газпром
- гмк норникель
- дивиденды
- доллар
- доллар рубль
- евро
- золото
- инвестиции
- индекс мб
- инфляция
- китай
- кризис
- криптовалюта
- лукойл
- магнит
- ммвб
- мобильный пост
- мосбиржа
- московская биржа
- мтс
- нефть
- новатэк
- новости
- обзор рынка
- облигации
- опрос
- опционы
- отчеты мсфо
- офз
- оффтоп
- прогноз
- прогноз по акциям
- раскрытие информации
- ри
- роснефть
- россия
- ртс
- рубль
- рынки
- рынок
- санкции
- сбер
- сбербанк
- северсталь
- си
- сигналы
- смартлаб
- сущфакты
- сша
- технический анализ
- торговля
- торговые роботы
- торговые сигналы
- трамп
- трейдер
- трейдинг
- украина
- фондовый рынок
- форекс
- фрс
- фьючерс
- фьючерс mix
- фьючерс ртс
- фьючерсы
- цб
- цб рф
- экономика
- юмор
- яндекс


 Новости тг-канал


