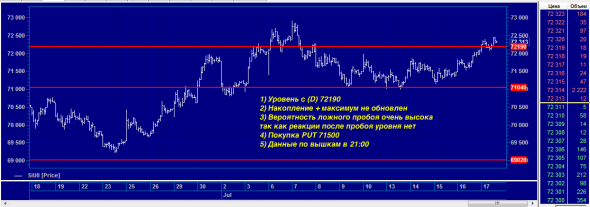
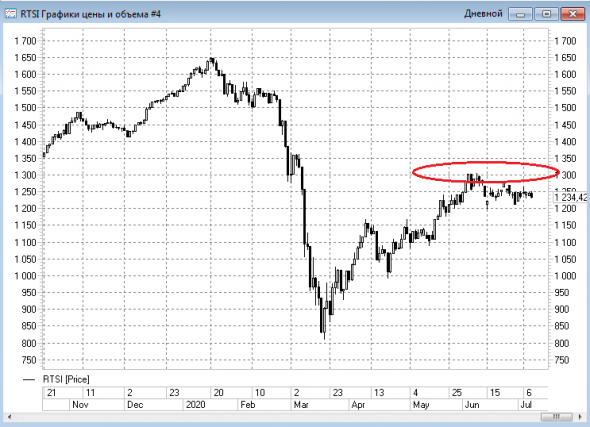
RTS
ришка 140-145 к середине сентября
- 21 июля 2020, 12:15
- |
iShares MSCI Russia ETF forms bullish «Bottom Triangle» chart pattern
Jul 20, 2020
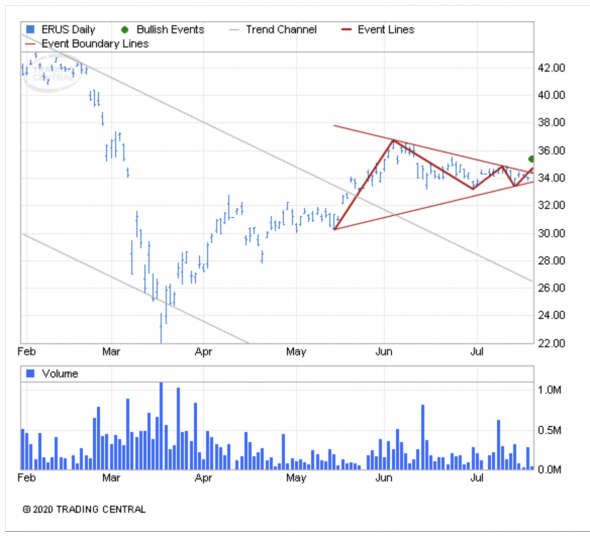
Recognia has detected a «Bottom Triangle» chart pattern formed on iShares MSCI Russia ETF (ERUS:NYSE). This bullish signal indicates that the stock price may rise from the close of $34.71 to the range of $40.25 - $41.50. The pattern formed over 47 days which is roughly the period of time in which the target price range may be achieved, according to standard principles of technical analysis.
Tells Me: The price seems to have reached a bottom, showing signs of reversal as it has broken upward after a period of uncertainty or consolidation. A Bottom Triangle shows two converging trendlines as prices reach lower highs and higher lows. Volume diminishes as the price swings back and forth between an increasingly narrow range reflecting uncertainty in the market direction. Then well before the triangle reaches its apex, the price breaks above the upper trendline with a noticeable increase in volume, confirming this bullish pattern as a reversal of the prior downtrend.
This bullish pattern can be seen on the following chart and was detected by Trading Central proprietary pattern recognition technology.
- комментировать
- Комментарии ( 3 )
Новая парадигма России, рубль, РТС, SP 500, золото...
- 02 июля 2020, 10:13
- |
Здравствуйте, коллеги!
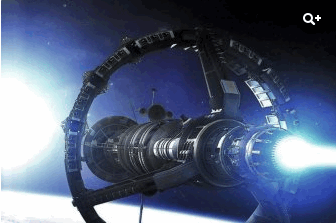
Впереди нас ожидает экономический рост, развитие фундаментальной науки (картинка из новости: «Росатом» планирует испытать прототип плазменного ракетного двигателя") дальнейшее укрепление позиций на мировой арене и отличные возможности для инвестиций.
Об этом и не только, был посвящён аналитический обзор нашего коллеги "..." (под видео есть поминутная расшифровка):
( Читать дальше )
Обсудим РТС
- 10 июня 2020, 15:12
- |
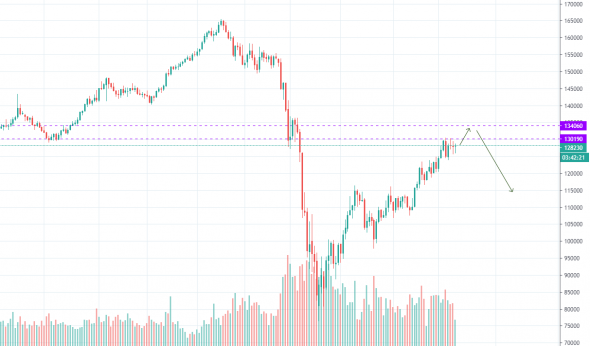
Жду локально выноса (сейчас вне позиций) и потом буду искать шорт по фьючерсу. Что думаете? до куда ждете рост?
Пока наш рынок отстает от американского, баксу уже вроде бы мало куда падать осталось.
Мой телеграм: Валютный десант
Отчет работы роботов за 5 месяцев 2020.
- 09 июня 2020, 07:49
- |
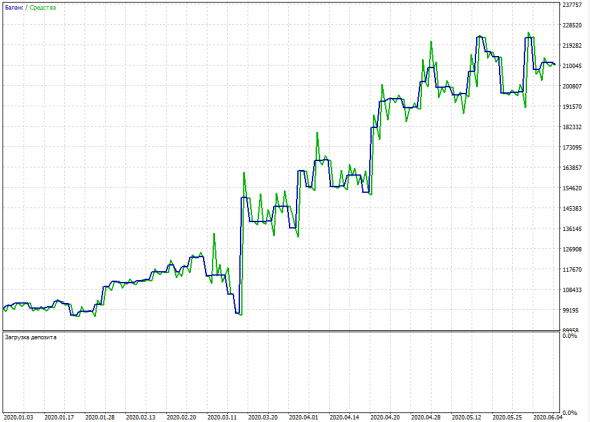
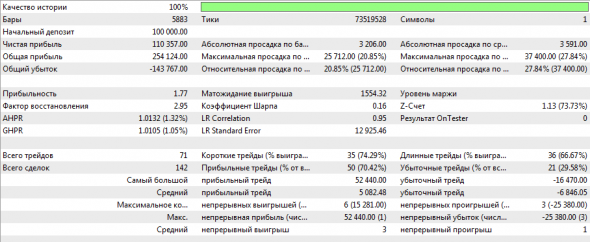
Всем привет! Много писать не буду, просто выкидываю статы роботов за 5 месяцев этого года, всё как всегда.
Si:
( Читать дальше )
Позовите меня на уровне 1153-1157. РТС
- 06 июня 2020, 22:01
- |
С точки зрения метода анализа Тактика Адверза по РТС получен значимый уровень в районе 1153, который уже/и далее будет в терминах ТА, — След, — сильным уровнем сопротивления/поддержки.
На дневном плане в модели расширения от начала тренда уровень НР показал на него, модель сформировалась в момент пробоя уровня т.4 (красной стрелкой обозначен бар) исторические данный здесь и далее получены с Stooq.com:

( Читать дальше )
Цель достигнута. А теперь "Горбатый"
- 20 мая 2020, 15:12
- |
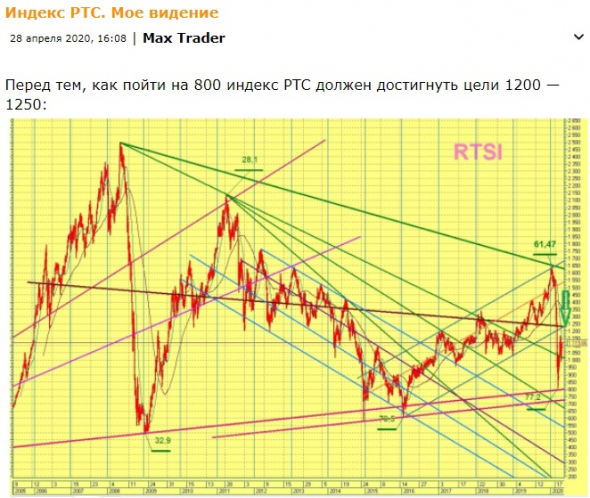
Всем успехов в торгах.
- bitcoin
- brent
- eurusd
- forex
- gbpusd
- gold
- imoex
- ipo
- nasdaq
- nyse
- rts
- s&p500
- si
- usdrub
- wti
- акции
- алготрейдинг
- алроса
- аналитика
- аэрофлот
- банки
- биржа
- биткоин
- брокеры
- валюта
- вдо
- волновой анализ
- волны эллиотта
- вопрос
- втб
- газ
- газпром
- гмк норникель
- дивиденды
- доллар
- доллар рубль
- евро
- золото
- инвестиции
- индекс мб
- инфляция
- китай
- кризис
- криптовалюта
- лукойл
- магнит
- ммвб
- мобильный пост
- мосбиржа
- московская биржа
- мтс
- нефть
- новатэк
- новости
- обзор рынка
- облигации
- опрос
- опционы
- отчеты мсфо
- офз
- оффтоп
- прогноз
- прогноз по акциям
- путин
- раскрытие информации
- ри
- роснефть
- россия
- ртс
- рубль
- рынки
- рынок
- санкции
- сбер
- сбербанк
- северсталь
- си
- сигналы
- смартлаб
- сущфакты
- сша
- технический анализ
- торговля
- торговые роботы
- торговые сигналы
- трамп
- трейдинг
- украина
- фондовый рынок
- форекс
- фрс
- фьючерс
- фьючерс mix
- фьючерс ртс
- фьючерсы
- цб
- цб рф
- экономика
- юмор
- яндекс


 Новости тг-канал
